Projects
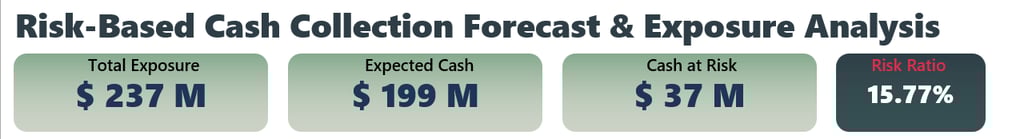
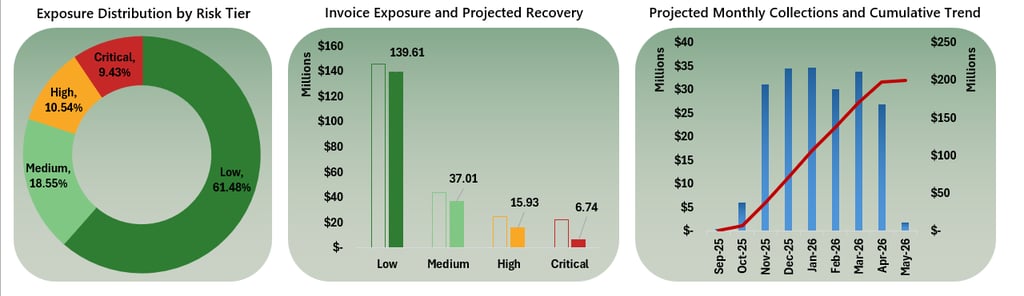
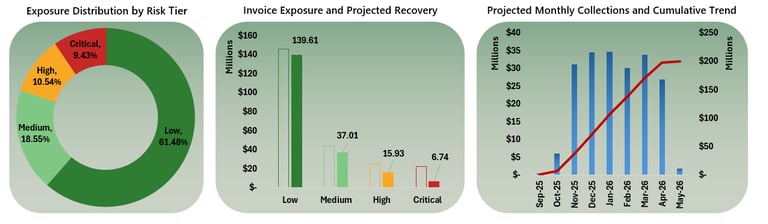
Executive Credit Risk Dashboard
Here is presented a business-oriented analytical solution designed to simulate how a fintech specializing in unsecured personal loans monitors risk, protects liquidity, and optimizes portfolio profitability.
Rather than functioning as a purely descriptive report, the dashboard is built as a decision-making framework that connects credit risk modeling with financial impact.


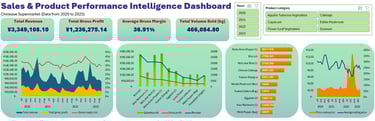
Revenue & Profitability Intelligence Dashboard (2020–2023)
This project analyzes ¥3.35M in sales data to evaluate whether business growth was truly value-creating
Through a structured dashboard combining KPIs, time-series margin analysis, product-level profitability, and pricing dynamics, the project uncovers how revenue, gross profit, and markup evolved over time
Tools Used: Excel (Power query, pivot tables), SQL (data cleaning and extracion)


Sales Performance Analysis -
SQL & Tableau Project
This project delivers a full analytical workflow using MySQL for data cleaning and analysis; and Tableau for interactive visualization
The objective was to uncover patterns in food sales across multiple product categories, including Solanum, Flower/Leaf Vegetables, Edible Mushrooms, and Aquatic/Tuberous Vegetables