Executive Credit Risk Dashboard
Portfolio Performance & Risk Monitoring Framework

This dashboard simulates the risk monitoring framework of a fintech specialized in unsecured personal loans. It provides a structured view of portfolio risk, borrower profile segmentation, pricing dynamics and default behavior.
Model Development – Probability of Default (PD)
Key Insights & Strategic Findings
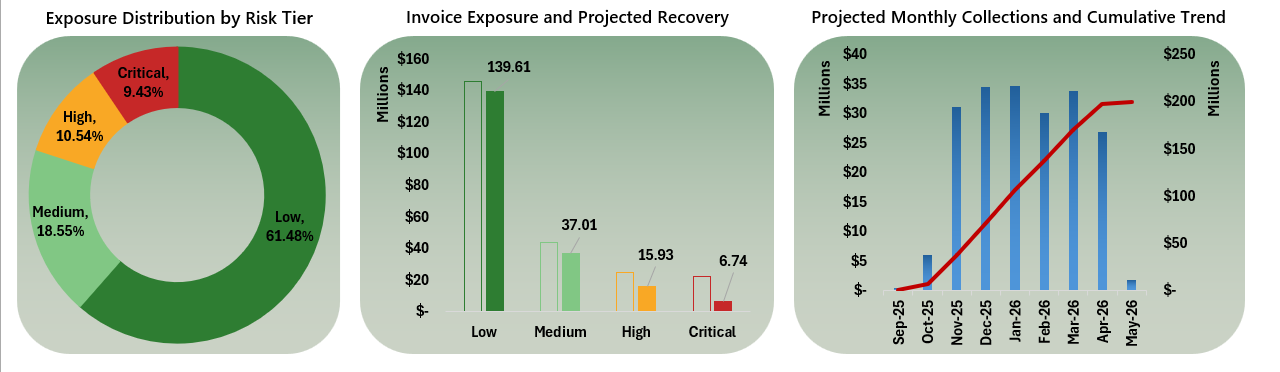
80% of the portfolio falls within low and medium risk levels, with less than 10% concentrated in the critical risk segment, reflecting a largely healthy portfolio with clear opportunities for preventive risk management
The portfolio shows an expected recovery rate of 84%, allowing anticipation of potential cash flow pressure
The projection indicates that the greatest cash flow erosion is concentrated within the critical segment, enabling prioritization of collection efforts and adjustment of cash flow forecasts accordingly
The cumulative curve shows a relatively steady progression of expected inflows, with no extreme concentration risk in a single month, supporting predictable liquidity planning. 64% of projected cash inflows occur between Jan–Apr 2026
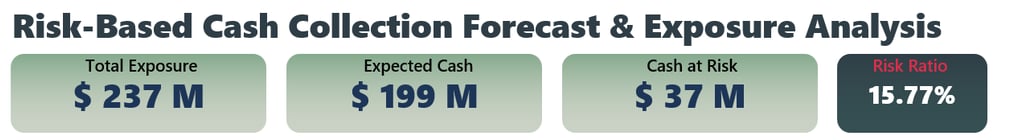
The portfolio presents a total exposure of 236M, of which approximately 37M is classified as expected risk according to the predictive model. This represents nearly 16% of the total portfolio. The tool enables prioritization of this critical segment and allows estimation of its impact on monthly cash flow.
The objective of this model was to estimate the Probability of Default (PD) for unsecured personal loans using borrower-level demographic, financial and credit behavior variables.
The model was designed to:
Support risk-based pricing decisions
Enhance underwriting criteria
Improve expected loss estimation
Enable portfolio risk segmentation
Given the unsecured nature of the lending structure, accurate PD estimation becomes the primary driver of credit risk management.
Methodology – Logistic Regression
A Logistic Regression model was implemented to estimate default probability.
Logistic regression is particularly suitable for credit risk modeling because:
The dependent variable (default vs non-default) is binary
It produces interpretable coefficients
Outputs are directly expressed as probabilities (0–1 range)
It is widely accepted in regulated financial environments
Mathematically, the model estimates the log-odds of default as a linear combination of explanatory variables:
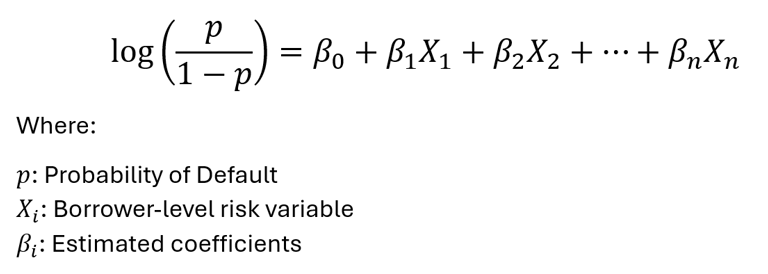

Feature Engineering
Several transformations were applied to enhance predictive signal:
Income segmentation into brackets (low / middle / high)
Encoding of loan grade categories
Historical default flag construction
Standardization of continuous financial variables where necessary
Verification of employment length and credit history consistency
Categorical variables were appropriately encoded to preserve economic interpretability.
Variable Selection
Variables were selected based on:
Economic intuition
Statistical significance
Multicollinearity assessment
Contribution to model stability
Key predictive variables included:
Loan grade
Interest rate
Historical default indicator
Employment length
Credit history length
Income segment
Loan intent
Exploratory Data Analysis (EDA)
Before formal model development, a structured Exploratory Data Analysis (EDA) was conducted to:
Understand borrower risk distribution
Identify preliminary risk drivers
Detect data inconsistencies
Validate economic relationships between variables
Support feature engineering decisions
The EDA phase served as the analytical foundation for the Probability of Default (PD) model.
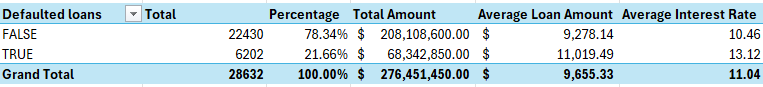
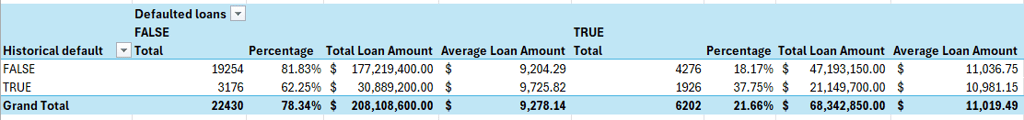
Defaulted Loans Global Distribution
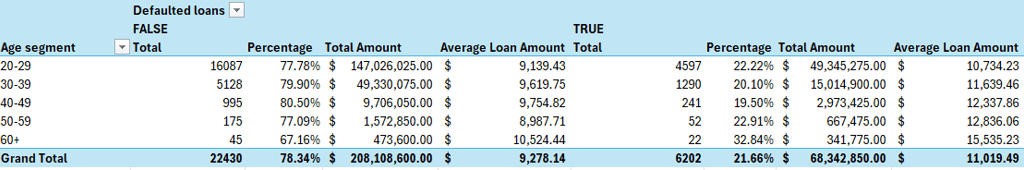
Defaulted Loans Age Distribution
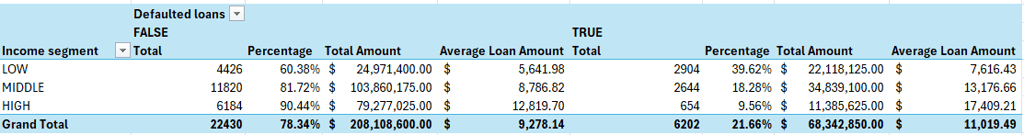
Defaulted Loans Income Distribution
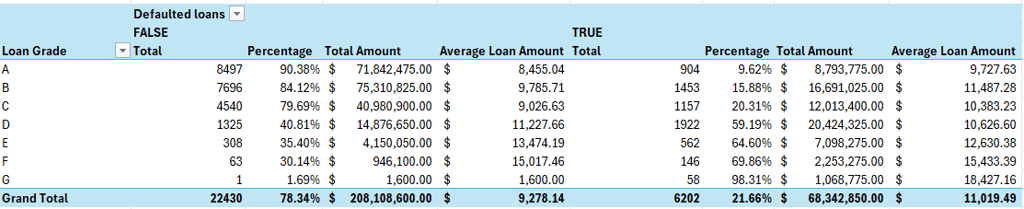
Defaulted Loans Grade Distribution
Defaulted Loans Historical Distribution